Documentation Index
Fetch the complete documentation index at: https://docs.traderframe.io/llms.txt
Use this file to discover all available pages before exploring further.
Overview
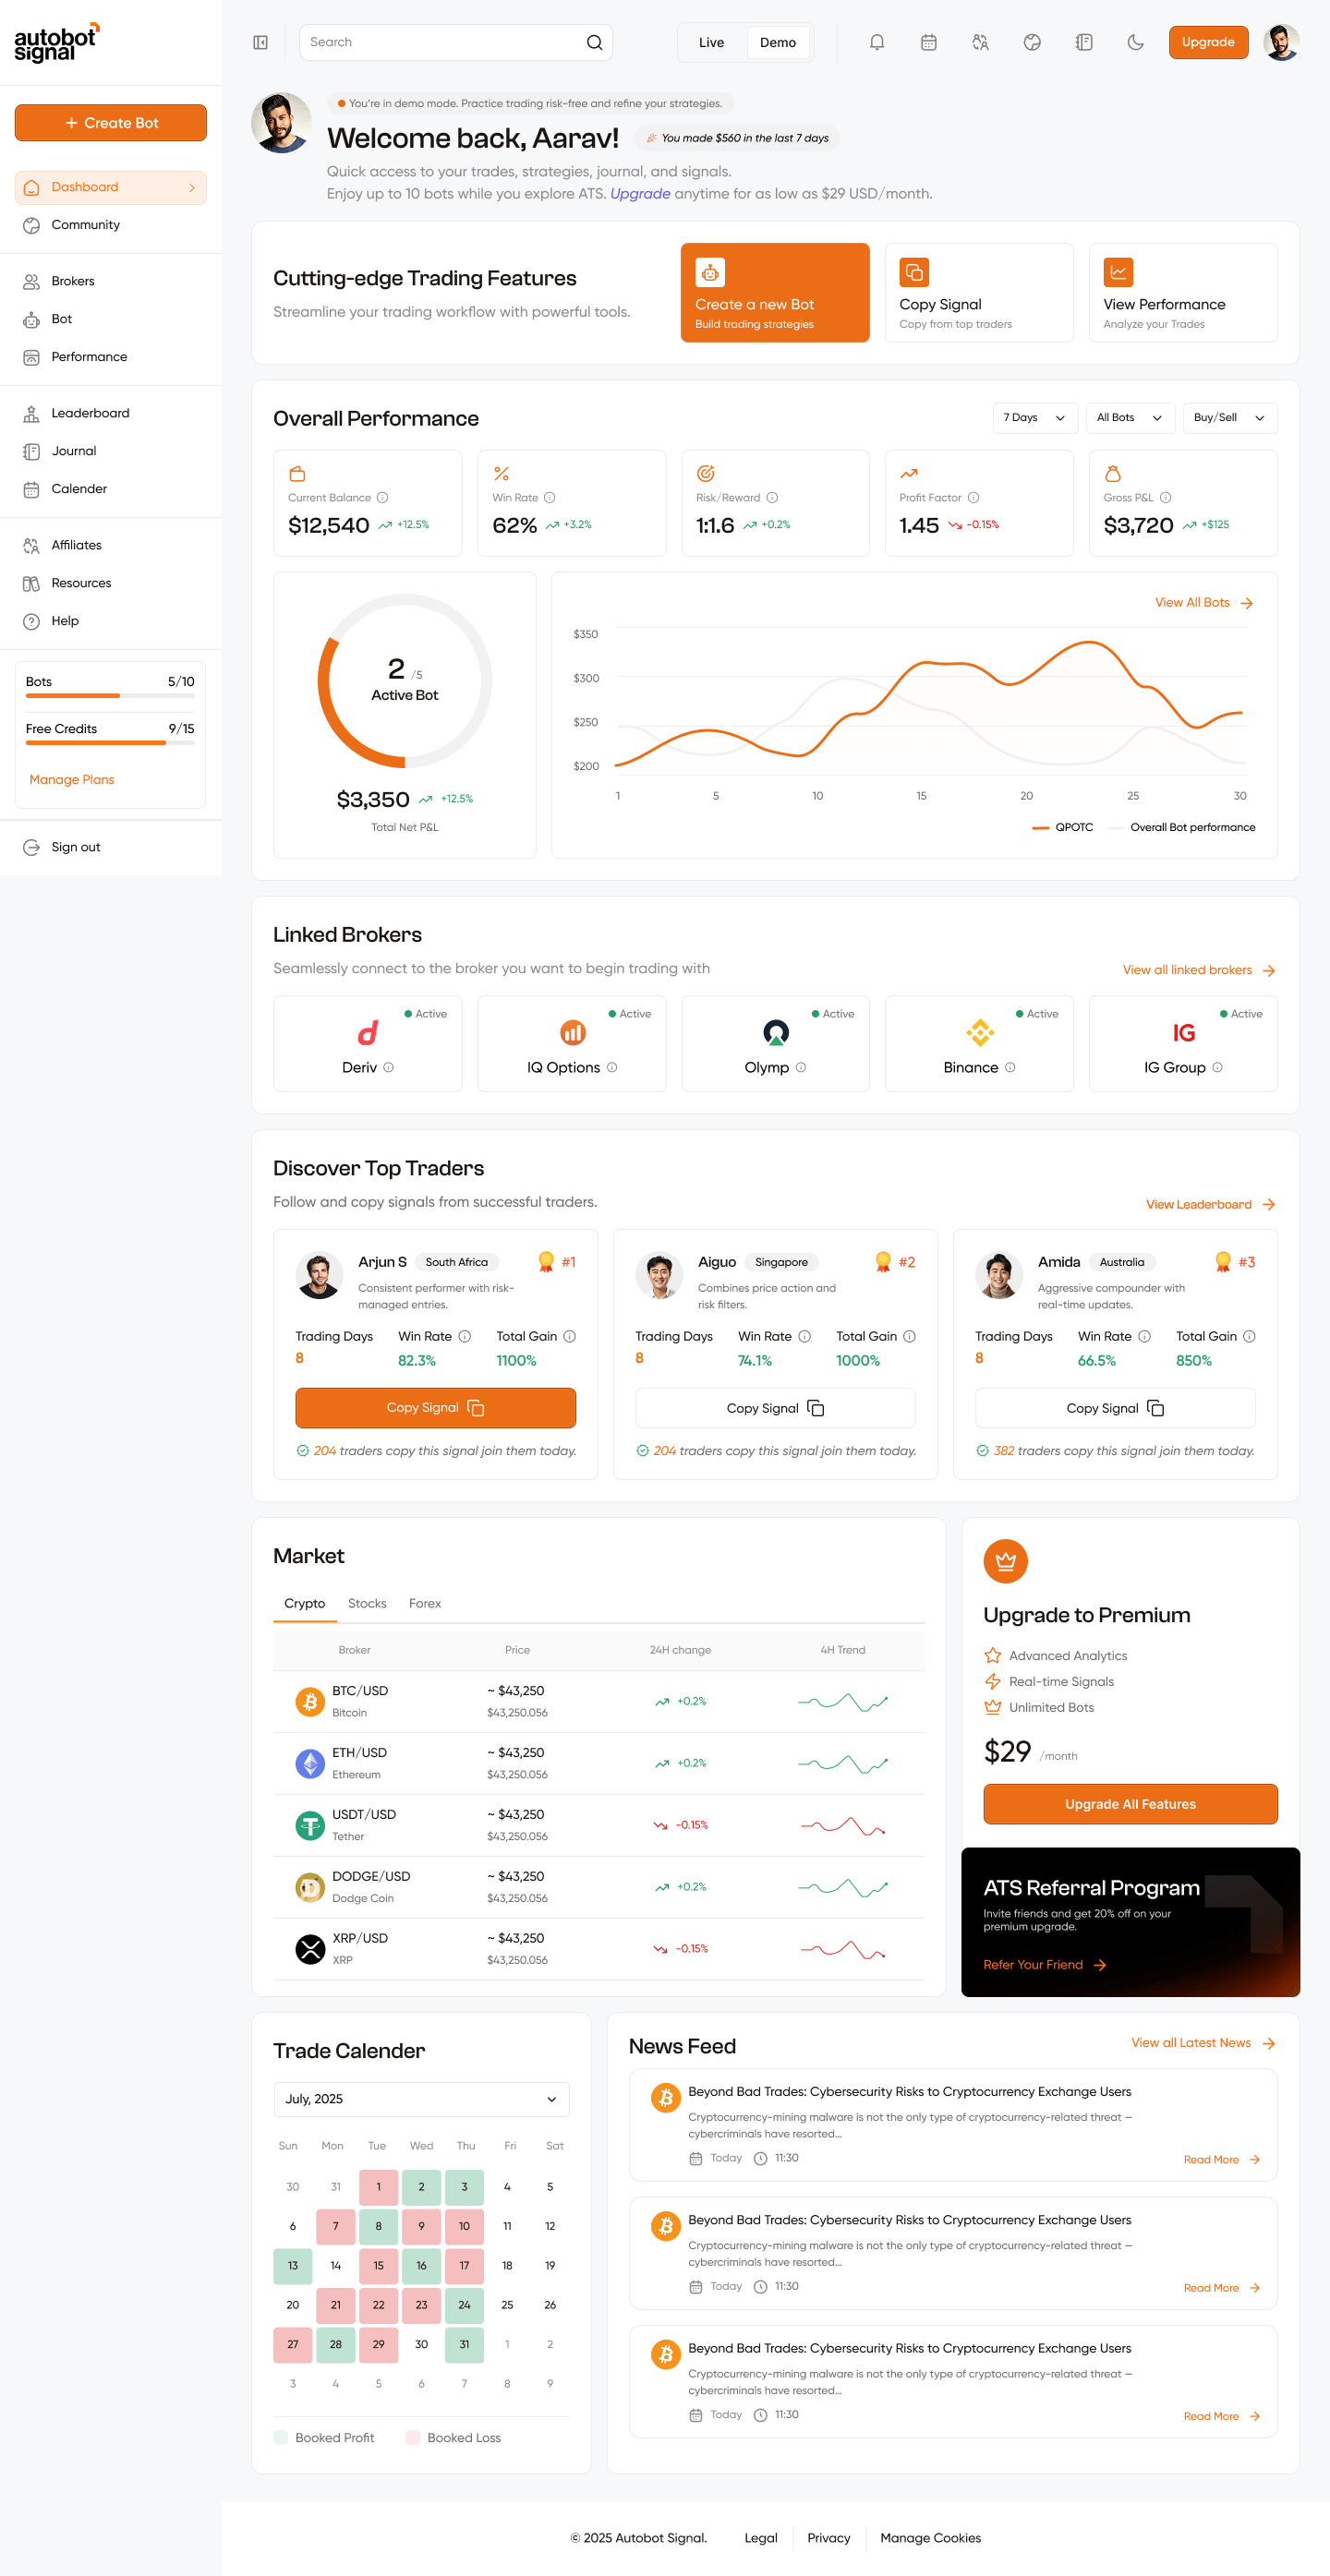
The Dashboard is the first page you see after logging in. It adapts to your onboarding state — showing setup guidance for new users and full analytics for users with brokers and bots connected.
URL: /dashboard
Here is the full dashboard at a glance:
Dashboard Layout Flow
┌─────────────────────────────────────────────────────────────────┐
│ DASHBOARD PAGE │
└─────────────────────────────────────────────────────────────────┘
┌─────────────────────────────────────────────────────────────┐
│ HEADER │
│ New user: "Welcome aboard, [Name] 👋" │
│ Returning: Avatar + "Welcome back, [Name]!" + earnings │
└─────────────────────────────────────────────────────────────┘
│
▼
┌─────────────────────────────────────────────────────────────┐
│ ONBOARDING STEPS BANNER (hidden once all 3 steps done) │
│ Step 1: Verify Email → Step 2: Connect Broker → │
│ Step 3: Create Bot │
└─────────────────────────────────────────────────────────────┘
│
▼
┌─────────────────────────────────────────────────────────────┐
│ CUTTING-EDGE TRADING FEATURES (3 quick-action cards) │
│ [Create a new Bot] [Copy Signal] [View Performance] │
└─────────────────────────────────────────────────────────────┘
│
▼
┌─────────────────────────────────────────────────────────────┐
│ OVERALL PERFORMANCE │
│ Stats: Balance | Win Rate | Risk/Reward | Profit Factor │
│ | Gross P&L │
│ Charts: Active Bot Radial + Performance Line Chart │
│ Filters: Period | Bot | Signal direction │
└─────────────────────────────────────────────────────────────┘
│
▼
┌─────────────────────────────────────────────────────────────┐
│ CONNECT BROKER BANNER (only when no broker connected) │
└─────────────────────────────────────────────────────────────┘
│
▼
┌─────────────────────────────────────────────────────────────┐
│ LINKED BROKERS │
│ Grid of connected brokers + status + Add Broker card │
└─────────────────────────────────────────────────────────────┘
│
▼
┌─────────────────────────────────────────────────────────────┐
│ DISCOVER TOP TRADERS │
│ 3 trader cards with stats + Copy Signal button │
└─────────────────────────────────────────────────────────────┘
── only after all 3 onboarding steps are complete ───────────
│
▼
┌────────────────────────────────┬────────────────────────────┐
│ MARKET │ UPGRADE PREMIUM │
│ Live prices: Crypto/Stock/ │ Plan upsell + Referral │
│ Forex with 4h sparkline trend │ │
└────────────────────────────────┴────────────────────────────┘
│
▼
┌────────────────────────────────┬────────────────────────────┐
│ TRADE CALENDAR │ NEWS FEED │
│ Monthly calendar coloured │ Forex/Crypto/Stock news │
│ green=profit / red=loss │ from live sources │
└────────────────────────────────┴────────────────────────────┘
The header sits at the very top of the dashboard content area and shows a personalised greeting. It has two different states depending on whether you’ve completed onboarding.
State A — New User (Onboarding Incomplete)
Shown when any of the 3 setup steps are still pending.
| Element | Details |
|---|
| Greeting | ”Welcome aboard, [Name] 👋“ |
| Sparkle badge | ”Kickstart your journey with ATS today!” |
| Subtitle | ”Let’s set up your first trade in 3 simple steps.” |
State B — Returning User (Onboarding Complete)
Shown after all 3 onboarding steps are done.
| Element | Details |
|---|
| Avatar | Your profile picture, or initials fallback if no image |
| Mode badge | Orange dot: “You’re in demo mode. Practice trading risk-free and refine your strategies.” / Green dot for Live mode |
| Greeting | ”Welcome back, [Name]!” |
| Earnings badge | ”You made $X in the last 7 days” |
| Description | ”Quick access to your trades, strategies, journal, and signals.” |
| Upgrade link | ”Upgrade anytime for as low as $29 USD/month” → /pricing |
The name shown is your firstName from your profile. If not set, it falls
back to your userName.
Section 2 — Onboarding Steps Banner
This banner appears automatically for new users who have not yet completed all 3 setup steps. It disappears permanently once all steps are done, or you can dismiss it temporarily by clicking the ✕ button in the top-right corner.
The 3 Steps
[ Verify Email ✓ ] → [ Connect Broker ] → [ 3. Create Bot ]
Step 1 Step 2 (active) Step 3 (locked)
| Step | Trigger | What Happens |
|---|
| Step 1: Verify Email | Automatic | Marked done after email is verified. Not clickable |
| Step 2: Connect Broker | Click the button | Opens the Connect Broker modal |
| Step 3: Create Bot | Click the button | Creates a new bot and redirects to /create-bot?botId=... |
Step Visual States
| State | Appearance | Behaviour |
|---|
| Done | Green border, green text, green ✓ checkmark | Not clickable |
| Active | Orange border, dark text | Clickable — triggers the action |
| Locked | Grey border, faded text, 60% opacity | Disabled — cannot click until previous step is complete |
Steps must be completed in order. You cannot create a bot before connecting a
broker.
Section 3 — Cutting-Edge Trading Features
Three quick-action cards that give one-click access to the most common tasks. The active card (hovered) turns fully orange with white text and a white icon.
| Card | Icon | Subtitle | Action |
|---|
| Create a new Bot | Robot/bot icon | ”Build trading strategies” | Creates a new bot record → /create-bot?botId=... |
| Copy Signal | Copy icon | ”Copy from top traders” | → /leaderboard |
| View Performance | Chart icon | ”Analyze your Trades” | → /performance |
The main analytics widget on the dashboard. Shows aggregated performance data across all your bots for the selected period.
Filters (Top-Right)
Three dropdowns let you slice the data. Any change immediately re-fetches all stats and charts.
| Filter | Options | Default |
|---|
| Period | 7 Days, 1 Month, 6 Months, 1 Year | 7 Days |
| Bot | All Bots, or any individual bot by name | All Bots |
| Signal | Buy/Sell, Buy, Sell | Buy/Sell |
5 Stats Cards
| # | Metric | Example | Description |
|---|
| 1 | Current Balance | $12,540 ↑ +12.5% | Total account balance with % change vs previous period |
| 2 | Win Rate | 62% ↑ +3.2% | Percentage of trades closed in profit |
| 3 | Risk/Reward | 1:1.6 ↑ +0.2% | Reward relative to risk per trade |
| 4 | Profit Factor | 1.45 ↓ -0.15% | Gross profit ÷ gross loss |
| 5 | Gross P&L | 3,720↑+125 | Total revenue before fees |
Each card has a trend arrow — green ↑ for improvement, red ↓ for decline.
Active Bot Radial Chart (Left)
| Element | Details |
|---|
| Ring | Fills proportionally: active bots / total bots |
| Center | Large number = active bots, /5 = total bots |
| Label | ”Active Bot” |
| Below | Total Net P&L with trend (e.g. $3,350 ↑ +12.5%) |
| Color | Orange when bots are active, grey when none |
Two lines plotted over time:
| Line | Color | Shows |
|---|
| Selected Bot (or “All Bots”) | Orange (primary) | PnL of your chosen bot |
| Overall Bot Performance | Light grey | Average across all bots |
- X-axis: dates (e.g. 1, 5, 10, 15, 20, 25, 30)
- Y-axis: dollar values (200–350 range in example)
- Hovering shows a tooltip with exact date and dollar value per series
- “View All Bots →” link in the top-right navigates to
/bot
- If no data exists: shows empty state icon with “No performance data available”
Section 5 — Connect Broker Banner
Shown only when no broker is connected yet. A full-width warm-toned banner with:
| Element | Details |
|---|
| Heading | ”Connect your broker to unlock 10 free Trades” |
| Subtitle | ”Secure. Fast. Required for trading.” |
| Connect Broker → | Orange button — opens the Connect Broker modal |
| Right side | Preview collage of supported broker logos |
Clicking the button opens the Connect Broker Modal which then leads to the Connect Broker Sidebar (slide-over panel) where you authorize a specific broker.
Section 6 — Linked Brokers
Visible in the full dashboard screenshot — shows all your connected broker accounts in a grid.
Broker Card
Each connected broker appears as a card:
| Element | Details |
|---|
| Logo | Broker’s logo image |
| Name | Broker name (e.g. Deriv, Binance, Bitget) |
| Status | Top-right: 🟢 Active or 🟡 Paused |
| Info icon | ⓘ for additional broker details |
| Element | Destination |
|---|
| ”View all linked brokers →“ | /brokers — full broker management page |
Connect Flow (when adding a new broker)
Click "Add Broker" or connect button
│
▼
Connect Broker Modal
(shows intro + confirms intent)
│
│ Click "Connect"
▼
Connect Broker Sidebar (slide-over)
(select broker → authorize via OAuth or API key)
│
│ On close:
├── Re-fetches linked brokers list
└── Re-fetches profile to update step completion status
Section 7 — Discover Top Traders
Shows the top 3 ranked traders from the leaderboard directly on your dashboard. Clicking any card or the Copy Signal button navigates to that trader’s full profile.
Trader Card Elements
| Element | Details |
|---|
| Avatar | Profile picture or default placeholder |
| Name | Trader’s username (e.g. Arjun S, Aiguo, Amida) |
| Country | Country badge (e.g. South Africa, Singapore, Australia) |
| Rank | 🥇 medal icon + #1, #2, #3 in orange |
| Bio | Short description of the trader’s style |
| Trading Days | Number of days active on the platform |
| Win Rate | % in green with ⓘ info icon |
| Total Gain | % in green (positive) or red (negative) with ⓘ icon |
| Copy Signal | Orange button for rank #1, outlined for others → trader profile |
| Copiers count | ”✓ X traders copy this signal join them today.” |
“View Leaderboard →” in the top-right navigates to /leaderboard.
Section 8 — Market
A live market data table powered by a real-time WebSocket connection to the backend. Only shown after all 3 onboarding steps are complete.
Asset Tabs
| Tab | Asset Class | Data |
|---|
| Crypto | Cryptocurrency | BTC, ETH, USDT, DOGE, XRP, etc. |
| Stocks | US equities | Major stock symbols |
| Forex | Currency pairs | Major forex pairs |
The active tab is underlined in orange. Switching tabs reconnects the WebSocket for the new category.
Table Columns
| Column | Description |
|---|
| Broker | Trading pair symbol (e.g. BTC/USD) + full name below (e.g. Bitcoin) |
| Price | Live price as ~ $X,XXX.XX with exact raw price below |
| 24H Change | % change with ↗ green arrow (gain) or ↘ red arrow (loss) |
| 4H Trend | Mini sparkline chart — green line = uptrend, red line = downtrend |
Section 9 — Trade Calendar & News Feed
These two widgets appear side-by-side at the bottom of the dashboard, only after onboarding is complete.
Trade Calendar (Left — 1/4 width)
A monthly calendar that colour-codes each day by your trading outcome.
| Colour | Meaning |
|---|
| 🟩 Green | Net profitable day (netPnL >= 0) |
| 🟥 Red/Pink | Net losing day (netPnL < 0) |
| No colour | No trades placed that day |
| Faded | Days outside the current month (padding) |
Month Selector — dropdown at the top lets you browse any month from January of the current year to the current month.
Legend at the bottom:
- 🟩 Booked Profit
- 🟥 Booked Loss
The calendar automatically updates when you switch between Live and Demo mode.
News Feed (Right — 3/4 width)
A live scrollable news feed covering Forex, Crypto, and Stock news.
| Element | Details |
|---|
| Source logo | Circular logo of the news publisher |
| Headline | Article title |
| Summary | Short 1–2 line description |
| Date | ”Today” for today’s news, or “MMM D” (e.g. May 12) |
| Time | Published time in your local timezone (HH:mm) |
| Read More → | Opens the full article in a new browser tab |
“View all Latest News →” link in the top-right of the section header.
Quick Navigation from Dashboard
| Click Target | Goes To |
|---|
| Create a new Bot card | /create-bot?botId=... |
| Copy Signal card | /leaderboard |
| View Performance card | /performance |
| View All Bots link | /bot |
| View Leaderboard link | /leaderboard |
| Trader card / Copy Signal | /leaderboard/trader-profile/[id] |
| View all linked brokers | /brokers |
| Upgrade link | /pricing |
| News Read More | External article URL (new tab) |